Based on machine learning and predictive techniques, real-time data from a heat map of each product in the shop can be analysed to find out how it is performing depending on where it is located and the way it is presented. Not only that, it is also possible to detect the areas of the shop with most traffic and how the customers move around it by using security camera images. Both these techniques enable “hot” or “cold” areas to be detected and thus optimise the way products are displayed in the shop.
Business benefits
Some consider visual merchandising to be one of the “dark arts” of retail, since it is quite a subjective and artistic means of improving a very specific KPI: sales. One of the challenges in this area is precisely getting the data to know what works and what doesn’t. Sales data is often a good starting point, but there are so many other factors at play that it can often be unwise to assume that a rise or fall in a product’s sales is only due to the way it’s being displayed. We need to take it one step further.
The work of comparing sales data to specific locations on the sales floor for each item and each store would be unfeasible if we did it manually. Nevertheless, thanks to RFID and artificial intelligence-based location techniques, a map of the store can be created at the same time as stock-taking is being carried out, thereby determining exactly where each item is in the store. In addition, thanks to computer vision, it’s now possible to determine which areas of the store are the “hot spots” for sales and which are underperforming.
This location information is then integrated with the sales data to generate an automated “money mapping” for each store as part of the regular reporting and analysis process. As a result, Visual Merchandising departments can focus on what’s really adding value, using this information to optimise product placement and store design. They can also try to take advantage of hot selling spots by prioritising the best locations for the best-selling items, high-value items, or items that are about to go out of season. All of this makes the most of the sales space, increasing sales per square metre and the stock turnover ratio, resulting in greater total revenue.
This technology also makes it possible to carry out more detailed analyses and experiments such as A/B testing of product combinations and store layouts, while paving the way for other use cases such as evaluating the work of sales staff, controlling queues and checkout areas, analysing the effectiveness of promotions and optimising business hours.
Furthermore, algorithms are capable of detecting aspects and patterns that the human mind cannot comprehend or cope with, thus enabling designers to create totally new design concepts that will most certainly delight their potential buyers.
Technology
Artificial vision
Predictive analytics
Challenges tackled
Successful cases
El Ganso, a Spanish brand with a long history in the world of fashion, has traditionally opted for innovation. In recent years, it has also been linked to the ISEM Fashion Business School fashtech accelerator. Thanks to this alliance, it has been able to test out technological solutions especially designed to transform a fashion company’s value chain. One of these is a heat map solution to optimise product displays in the store so as to increase the space’s profitability. The tool uses predictive analytics and machine learning to analyse the heat map of each of the store’s products in real time in order to know how it is doing depending on the area where it is placed and the way it is being displayed. With this information, their Visual Merchandising team will be able to make better decisions about the layout and display of products in the store.
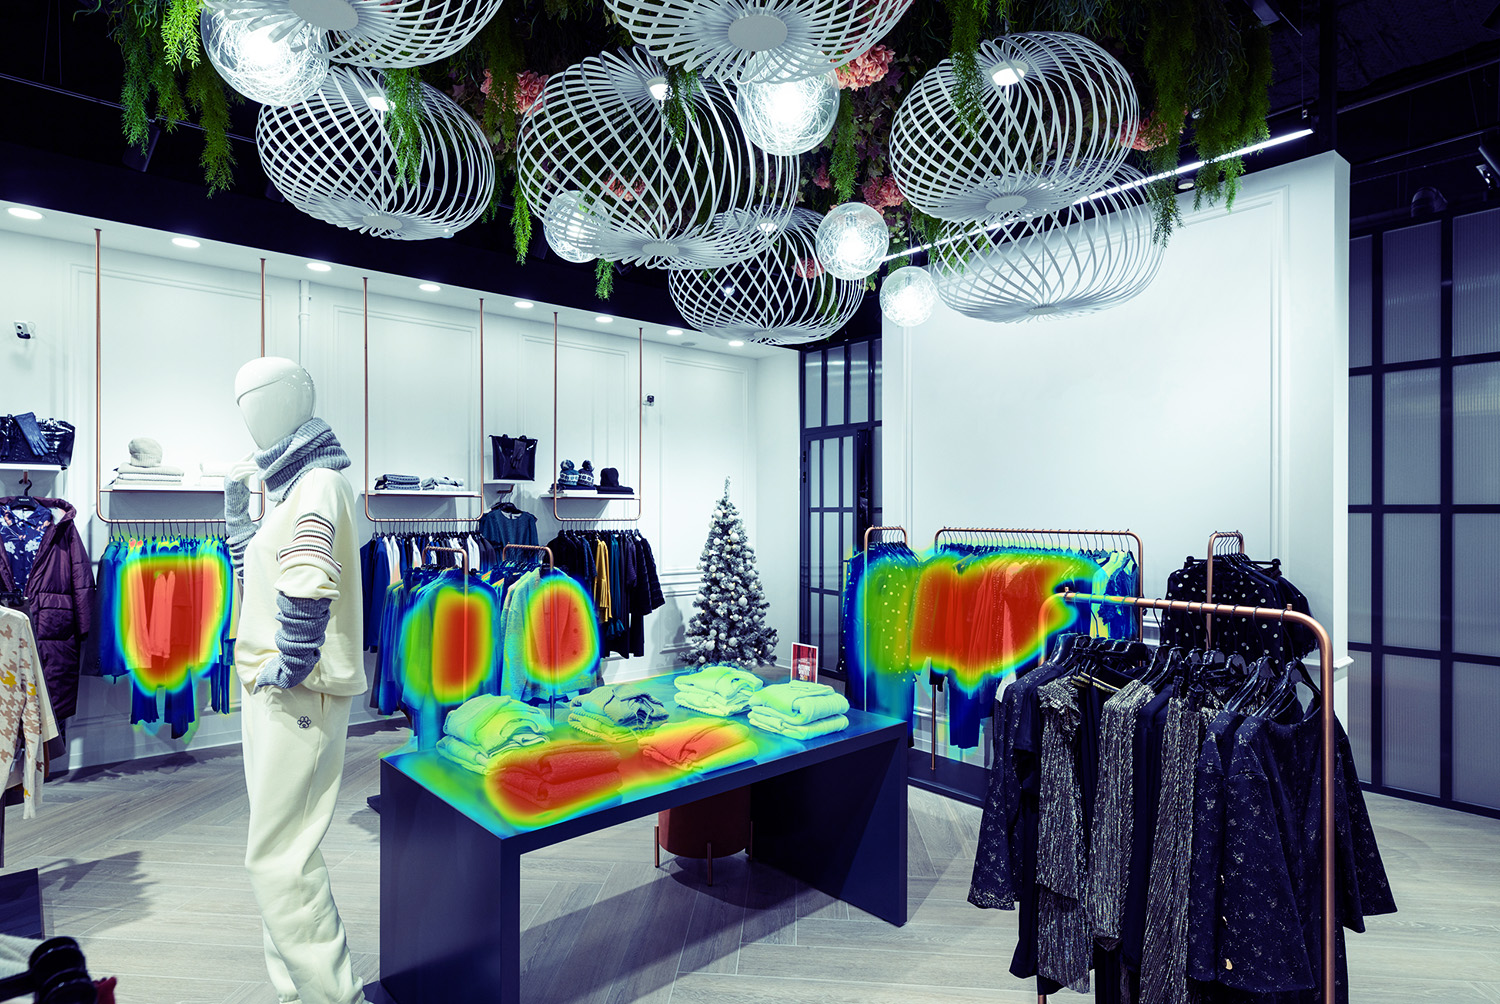
Visualisation of a heat map in a physical shop.
Betabrand, a womenswear brand world famous for its yoga pants suited to almost any situation, has also used heat maps in its San Francisco flagship store to see what zones have the most customer traffic there. This has enabled them to optimise the store’s layout and create strategies about where to place popular or unpopular goods, and expensive or cheap ones. A second type of heat map they have used is one that concentrates on what people touch but don’t buy where they walk by. This has helped them identify pricing problems. If a lot of people touch a product but few buy it, this could be a sign that it’s too expensive. In addition, it also allows them to relegate uninteresting items to less prominent locations and vice versa.
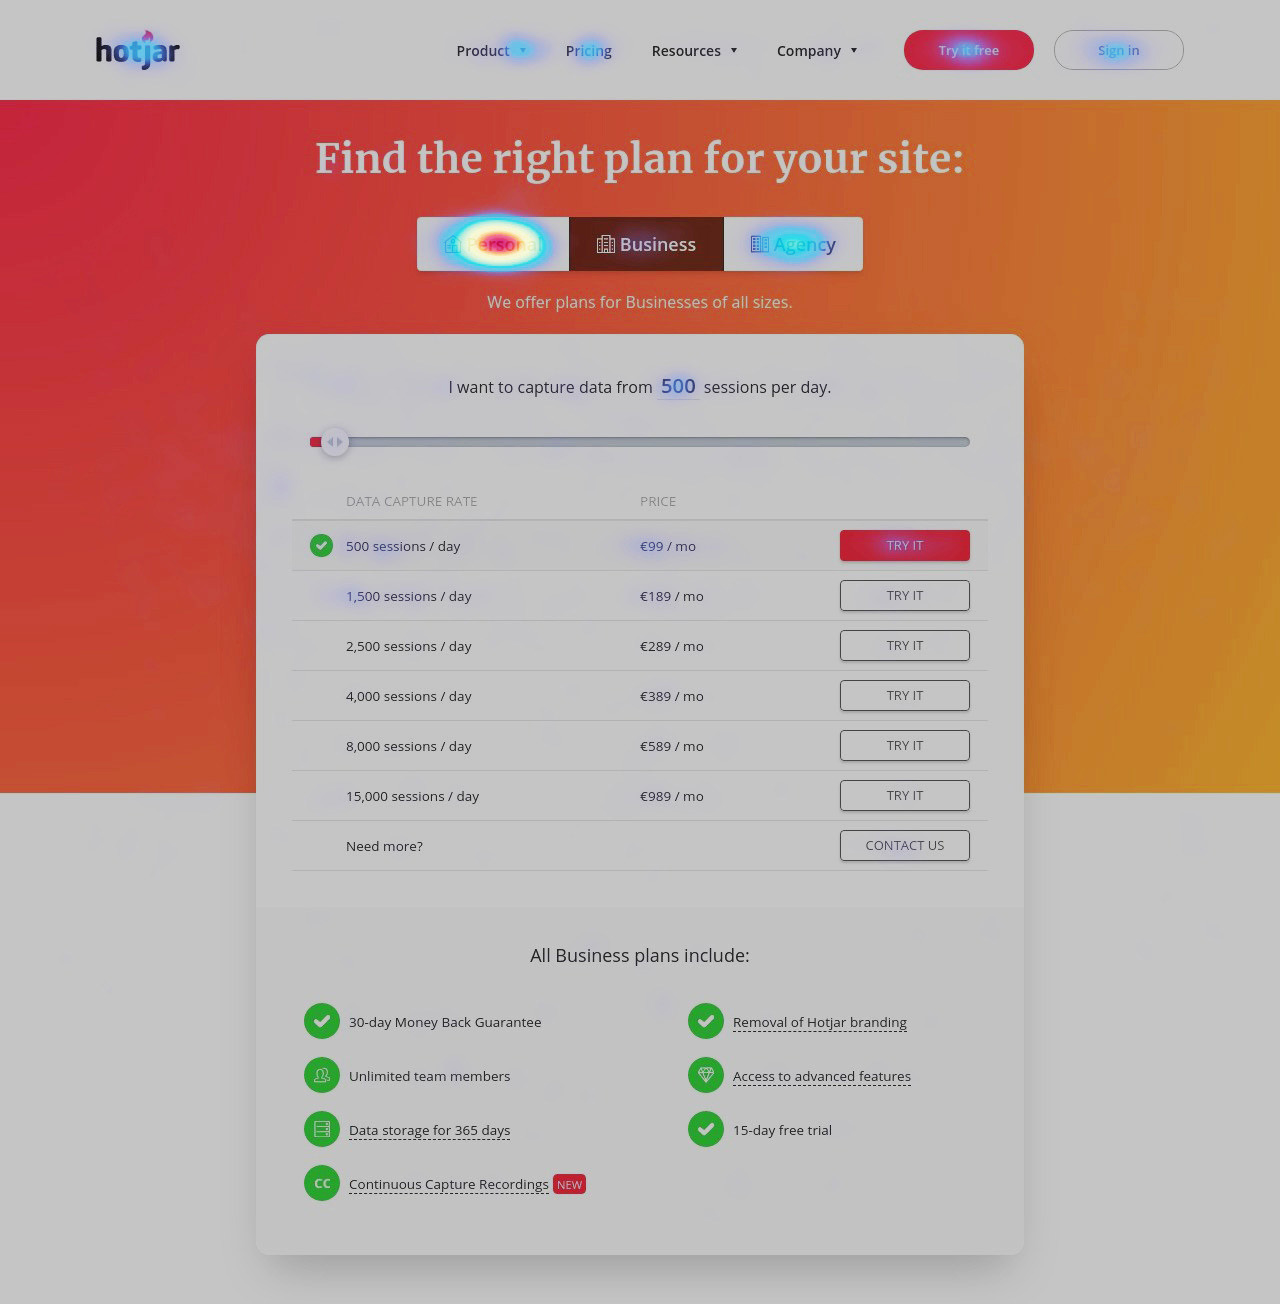
Heatmaps can also be used in apps, landing pages and online stores. Source: Hotjar
Talk to us
Get in touch with the team to see how we can help you.
Error: Contact form not found.


